Progress photos naturally raise a question: could software just read your body fat percentage straight from the picture? It already can, and a peer-reviewed study puts a real number on how well — closer to a DEXA scan than most people expect, under specific conditions, and not at all under others.
The short answer
- A photo-based AI model, validated against DEXA in 134 adults, had a mean absolute error of about 2.16 percentage points — tighter agreement with DEXA than three consumer body-fat scales tested in the same study.
- It needs two photos (front and back), minimal form-fitting clothing, even lighting, and the camera 4 to 6 feet away.
- It is not a DEXA scan. Loose clothing, poor lighting, an off pose, or scanning right after a workout will produce a number that looks precise and is not.
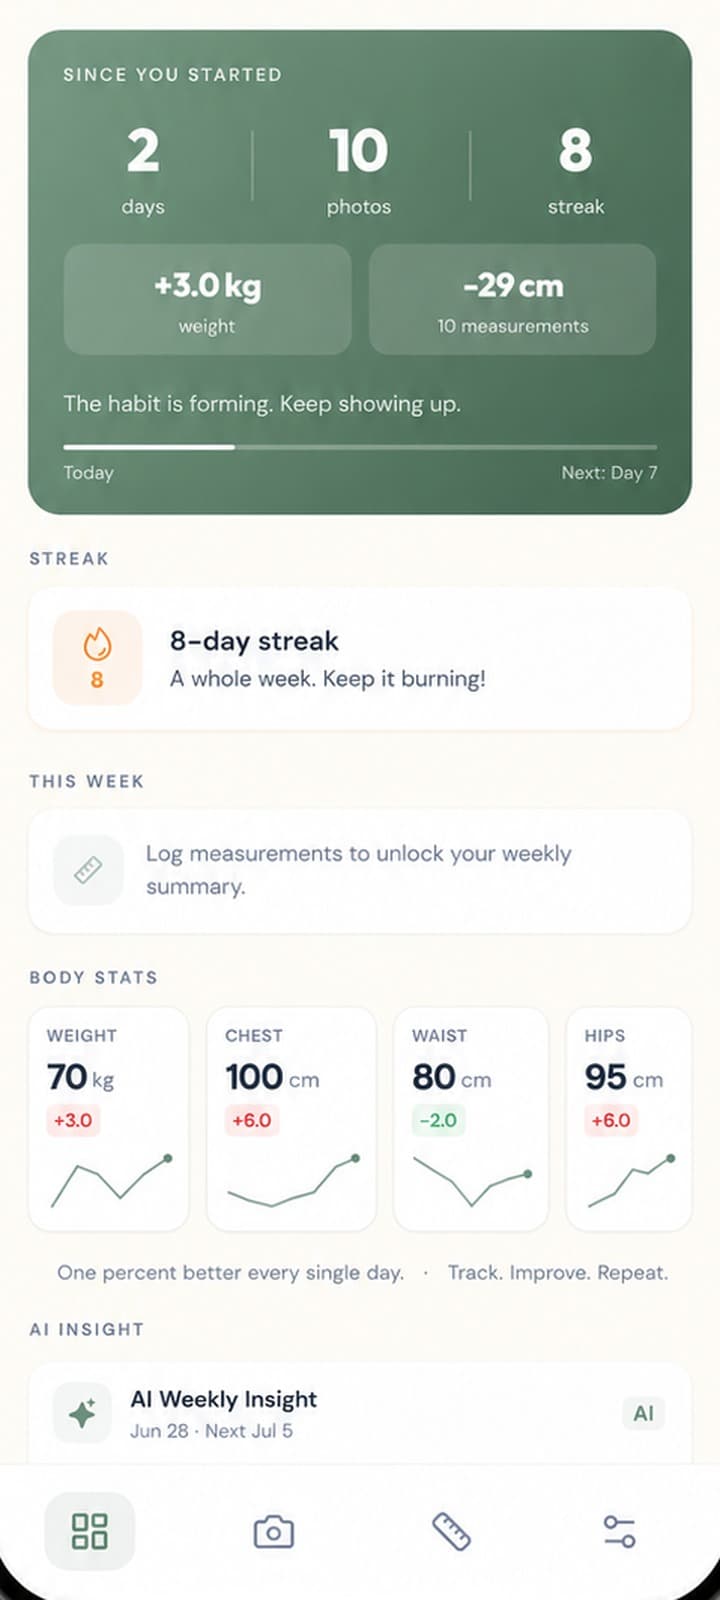
- One estimate is a data point. A trend across several weeks is the actual signal — the same rule that applies to the scale and the tape measure.
How an AI photo estimate actually works
The best-validated version of this — published in npj Digital Medicine as "Smartphone camera based assessment of adiposity" — works from two-dimensional photographs taken on an ordinary phone. Researchers had participants photographed from the front, back, and both side profiles, though only the front and back images were used to estimate body fat (Wong et al., 2022).
The model needs three things to work well:
- Minimal, form-fitting clothing — no jackets, no loose shorts, nothing that obscures the body's outline.
- A consistent pose — standing in an "A" position, arms slightly away from the body, with the midsection visible.
- Consistent camera setup — positioned 4 to 6 feet away, at roughly knee height, without an extreme tilt.
Under the hood, a convolutional neural network segments the person from the background, then reads body-shape features correlated with fat mass — the same underlying idea as a trained eye estimating body composition from shape, but quantified and repeatable. It is a close cousin of the technique behind comparable progress photos: both depend on holding lighting, distance, and pose constant so the only thing that changes between shots is the body.
What the accuracy numbers actually say
Here is where the study gets specific rather than promotional. Across 134 adults (mean age 43, BMI range 18.5–51.6), the photo-based model produced a mean absolute error of 2.16 ± 1.54% against DEXA, with a Lin's concordance correlation coefficient of 0.96 — a measure of how closely two methods agree, where 1.0 is perfect agreement. The bias was −0.42%, meaning the model did not systematically over- or under-estimate in one direction.
For context, the same study tested the photo method against several other home and clinical methods, all measured against the same DEXA reference:
| Method | Mean absolute error vs. DEXA |
|---|---|
| AI photo estimate | 2.16% |
| Professional BIA scale | 3.13% – 4.72% |
| Air displacement plethysmography (Bod Pod) | 3.14% |
| Consumer BIA scale | 4.48% – 5.85% |
The photo estimate outperformed every field method it was tested against, including the Bod Pod — a device most gyms don't even have access to (Wong et al., 2022).
The result held up when split by sex, which matters because body-fat estimation methods often perform unevenly between men and women. Men had a mean absolute error of 1.88 ± 1.3% (concordance 0.94); women had 2.34 ± 1.6% (concordance 0.93) — both still tighter than any BIA scale tested in the study. The method was also consistent with itself: photographing the same person twice produced limits of agreement of −1.64% to +1.51%, meaning repeat scans under the same conditions landed within about 1.6 percentage points of each other almost every time.
That overall accuracy is worth putting next to how the more familiar methods perform. A separate comparison of DEXA, skinfold calipers, and bioelectrical impedance in young athletes found skinfold measurements correlated with DEXA at R = 0.909, and BIA at R = 0.877 — with BIA significantly underestimating fat percentage compared to DEXA (Micić et al., 2022). None of these field methods, photo included, replace a clinical scan. But the ranking is informative: a correctly-taken photo estimate lands closer to DEXA than the bathroom scale most people already trust.
It is also worth being clear about what this study does and doesn't establish. One validation study, however well-designed, is not a settled fact — it is 134 people, mostly at two research sites in the United States, with a BMI range that does not extend into every population these tools now target. The direction of the result (photo methods can match or beat consumer BIA) has since been echoed in follow-up work, but the exact error margins will vary by implementation. Treat the specific numbers here as evidence that the approach can work well, not as a guarantee that every app using a similar idea performs identically.
Where the accuracy breaks down
The 2.16% figure is what the model achieves under the exact conditions the study specified. Move away from those conditions and the number gets worse — and the study is specific about how:
- Clothing. The model was trained on people in minimal, form-fitting clothing. Full sleeves, loose pants, or baggy shorts hide the body outline the model depends on and will produce inaccurate results.
- Lighting. Extremely dark or overly bright images can hide the visual information the model reads.
- Camera and pose. Extreme tilt, a camera positioned too far away, holding the stomach in, or flexing muscles all distort the estimate.
- Timing. Scanning immediately after an intense workout or a large meal — the same fluid-shift issue that affects scale weight — measurably changes the reading.
- Range. The model does not generate estimates above 64% body fat, and it cannot tell you whether fat is visceral (around the organs) or subcutaneous (under the skin) — a distinction that matters for health risk and that no 2D photo can currently resolve.
None of this makes the method unreliable. It makes it conditional, in exactly the way a tape measurement is conditional on tape tension and a scale reading is conditional on hydration. The failure mode isn't the technology — it's skipping the setup and trusting the output anyway.
Why a photo can outperform a bathroom scale
It seems backwards that a photograph would beat a device that runs an electrical current through your body, but the explanation comes down to what each method is actually measuring.
Bioelectrical impedance (BIA) — the technology in most consumer body-fat scales — estimates fat by measuring how much resistance your tissue creates against a small electrical current. Water conducts electricity far better than fat does, so BIA is really inferring fat mass from hydration levels. Anything that shifts your water — a workout, a salty meal, alcohol, the time of day — shifts the reading, independent of any real change in body fat. That is the mechanism behind the wider error margins BIA scales show across every validation study, consumer and professional alike.
A photo-based model isn't measuring electrical resistance. It is reading body shape — the visual features that correlate with how fat is distributed — which doesn't swing with same-day hydration the way impedance does. That is not a claim that photos capture something BIA misses entirely; it is a difference in what source of noise each method is vulnerable to. Photos are vulnerable to clothing, lighting, and pose. BIA is vulnerable to hydration. The validation numbers reflect that difference.
What this means for how you actually use it
The practical takeaway isn't "AI photo estimates are accurate" or "AI photo estimates are unreliable." It's that they behave like every other body composition method: precise under controlled conditions, noisy outside them, and most useful as a trend rather than a verdict.
That mirrors the same logic that applies to reading recomposition signs more broadly — no single number, whether from a scale, a tape, or a photo model, is meant to stand alone. What makes any of them useful is repeating the same method, under the same conditions, often enough to see a real trend separate from day-to-day noise.
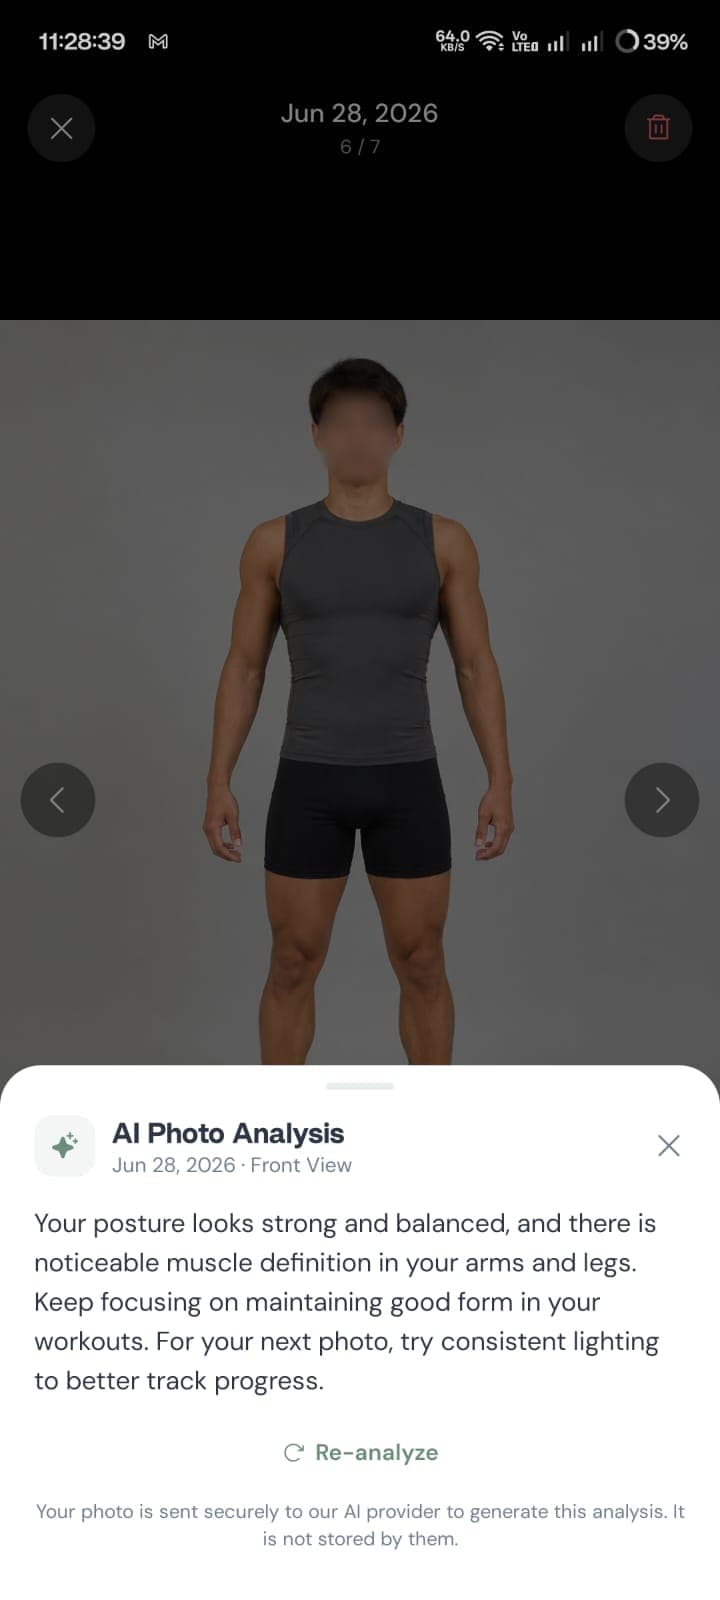
If an app offers this kind of estimate as an opt-in feature — sending a photo for analysis only when you explicitly ask, rather than scanning every photo automatically — that design matches how the underlying method actually works: a deliberate, occasional check under good conditions, not a background number attached to a photo you took for a completely different reason.
Bottom line
A correctly-taken AI photo estimate, validated against DEXA, lands closer to the gold standard than a consumer bathroom scale and even a Bod Pod in at least one peer-reviewed study. It gets there by requiring specific conditions — form-fitting clothing, even lighting, correct distance and pose — and it degrades in predictable ways when those conditions aren't met.
Treat one reading as noisy and a multi-week trend, taken under the same conditions each time, as the actual answer.